Aktywne Wpisy

WielkiNos +390
Juleczka po kulturoznawstwo chwali się dyplomem w sposób sugerujący, że zdobyła go nie tą częścią ciała, którą się go zwykle zdobywa.
#bekaztwitterowychjulek #p0lka #studia #bekazpodludzi #logikarozowychpaskow
#bekaztwitterowychjulek #p0lka #studia #bekazpodludzi #logikarozowychpaskow

źródło: temp_file2614539208647029454
Pobierz
Nighthuntero +761
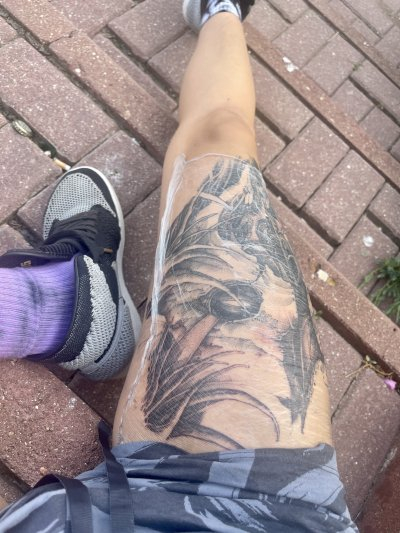
Tak chciałem tylko przypomnieć w jakim cuckoldstanie żyjemy.
Wariatka opublikowała wpis w którym bez żadnych dowodów oskarżyła tatuażystę o molestowanie/gwałt podczas wykonywania jej tatuażu. Jak się oczywiście okazało wszystko zmyślała, aby tylko nie zapłacić za tatuaż. Wykopki od razu zaspamowały sociale, że gość jest gwałcicielem.
Jakie poniosła konsekwencje w cuckoldstanie? Dokładnie tak, macie rację, żadnych.
Moderacja Wykopu i stecka szczególnie się popisali, nie usuwając wpisu przez ponad tydzień.
#p0lka #

źródło: 1000016937
Pobierz


![Jak pustoszeją rosyjskie magazyny sprzętu pancernego [PODCAST]](https://wykop.pl/cdn/c3397993/41a73a7fb518169a293093dacf000c4b57d8a6174d889a43272e15f365e02b86,q80.jpg)
Opis ze znaleziska:
Film pokazuje cykl gromadzenia się w atmosferze CO2 w ciągu jednego roku. Każdego roku roślinność i oceany pochłaniają około połowy emisji CO2 spowodowanych przez człowieka. Jednak, corocznie ok 2,5 ppm CO2 pozostaje w atmosferze powodując stały wzrost stężenia, który naukowcy śledzą od lat 50-tych.
Szerszy opis:
https://climate.nasa.gov/climate_resources/296/global-carbon-dioxide-2020-2021/
https://svs.gsfc.nasa.gov/4949
P.S. Jako dodatek do wpisu załączam grafikę ukazującą anomalie temperatury na powierzchni Ziemi, względem średniej z lat 1951-1980, na przestrzeni (od lewej) ostatniego miesiąca, ostatnich trzech miesięcy oraz ostatnich dwunastu miesięcy. http://www.columbia.edu/~mhs119/Temperature/
https://twitter.com/ZLabe/status/1475855349966069760
@pitersi
#nauka #polska #europa #swiat #klimat #globalneocieplenie #ciekawostki #gruparatowaniapoziomu #mikroreklama
źródło: comment_16407657861rHimGYWkNVeQUdsTt8DSb.jpg
Pobierz