#python
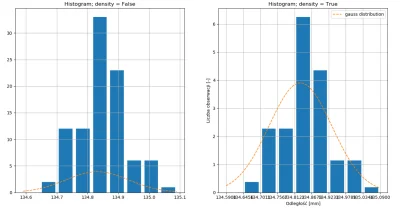
Cześć Mirki, mam do Was pytanie odnośnie funkcji pyplot.hist() i jej argumentu "density"
Wytłumaczenie w dokumentacji: "
density : bool, optional
If True, the first element of the return tuple will be the counts normalized to form a probability density, i.e., the area (or integral) under the histogram will sum to 1.This is achieved by dividing the count by the number of observations times the bin width and not dividing by
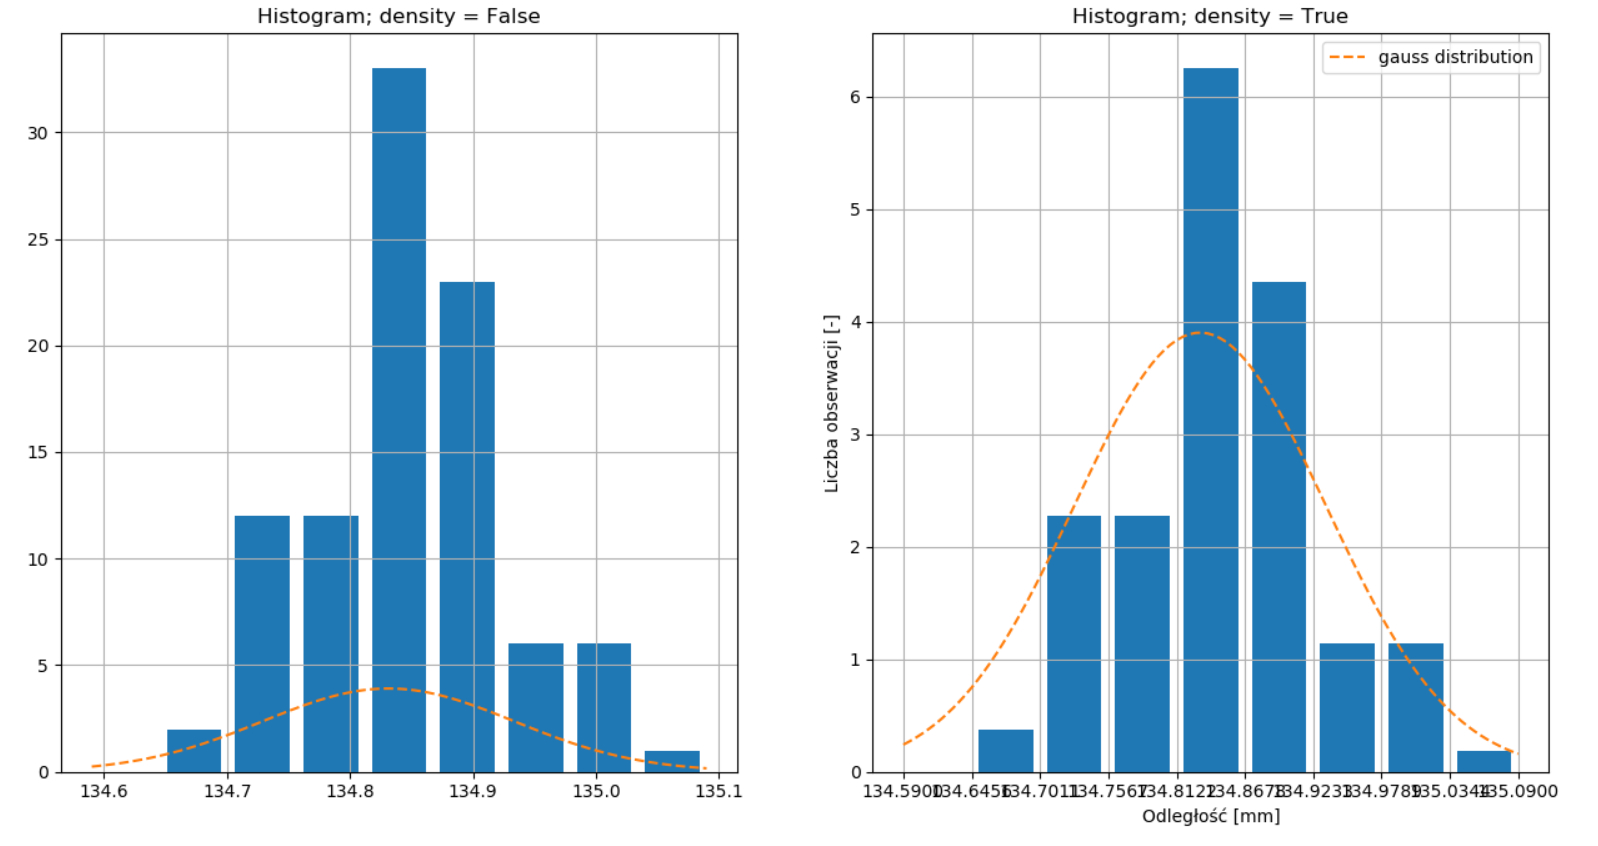
#machinelearning
Cześć Mirki, czy ktoś z Was miał taką sytuację, że wyjście modelu zawsze odwzorowuje ten sam kształt krzywej? W żadnym wypadku nie udało mi się odwzorować tych "oscylacji" rzeczywistej wartości.
Model regresji liniowej, na wejściu dwie funkcje sinus (jako predytkory w modelu). Niezależnie od liczby epok, optymalizatora i wartości learningrate, aktywacji warstwy, liczby neuronów i wielkości zbioru
źródło: comment_1596815045UlO9agHkfVIXQDySsb5BNb.jpg
Pobierz@ProfesorBigos: próbowałem, z takim samym efektem