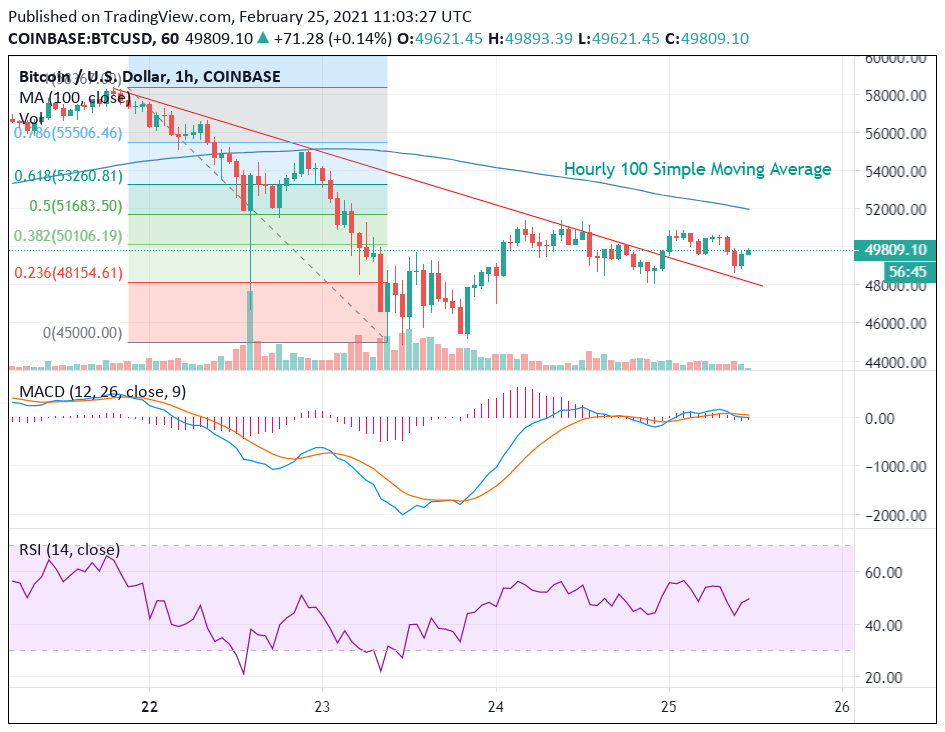
After the recent dip of nearly 22%, the bulls are trying to regain 100-Simple Moving Average support.
Currently, BTC / USD price is trading at $ 49,000, well above the 23.7% Fib retracement level from last swing high at $ 58.250 to swing low at $ 45,000. There was also a break above the resistance trend line. However, there is a key resistance level at $ 51,650 yet to be cleared to trigger fresh momentum. This key resistance level is the 50% Fib retracement level of the downward wave from the $ 58.400 swing high to $ 45,000 swing low. Also, the 100 hourly simple moving average is nearing $ 51,650.

BTC Gains limited?
In case the Bitcoin price successfully closes above the resistance level ($ 51,650), the Bitcoin could try to push past the 53,250 and 55,000 levels.
Another dip for BTC?
If the Bitcoin USD price fails to clear the $ 51,650 resistance level, the lost momentum could trigger selling pressure. In the downtrend, initial support could be near $ 48.150. In case there is a clear break below the $ 48.150 level, the price could retest the $ 45,000 support level.
Technical indicators:
- Based on hourly BTC USD price change, the MACD is gaining momentum towards the bullish zone and the RSI of BTC / USD is above the 50-level.
- Major support is at $ 48.150, followed by $ 45,000 and $ 40,000.
- Major resistance at $ 51,650, $ 53,250 and $ 55,000.


Komentarze (2)
najlepsze